AM SQL/Express 13 Sample Reports
|
Accounts Receivable - Sales Analysis Reports
The Sales Analysis Reports provides various information that helps management analyze top sales performance based on sales amounts by customer, customer class, industry, territory, and salesperson. Each of the Sales Analysis Reports is especially designed to display information in grid and graph formats. Read the information below to get a closer look at each of the Sales Analysis Reports available in AccountMate.
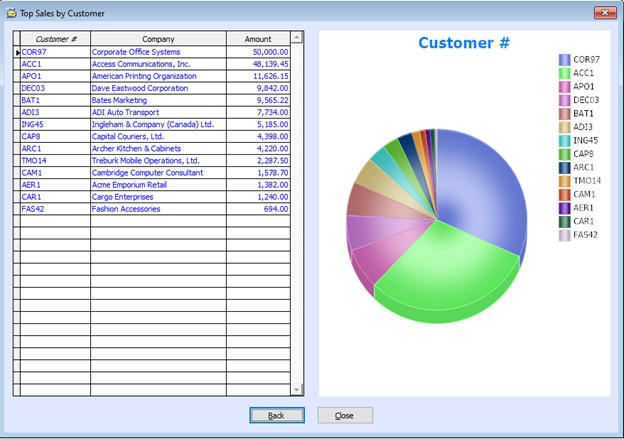
The Top Sales by Customer function provides information on the companys top-performing customers based on total sales amounts. Within the data grid, you can view the customer number, company name, and sales amount, all ranked from highest to lowest, according to user-defined parameters, including customer number, invoice number, salesperson number, class, industry, territory, and invoice date. You can export the information from the grid to a Microsoft Excel file. A pie graph is also shown to help visually represent the proportion each customer contributes to the total sales during the specified period. This visualization helps in identifying quickly key customers and their relative impact on overall revenue. This function is useful for identifying top revenue-generating customers and planning sales and
marketing strategies, thereby maximizing profitability and fostering relationships with high-value
clients.
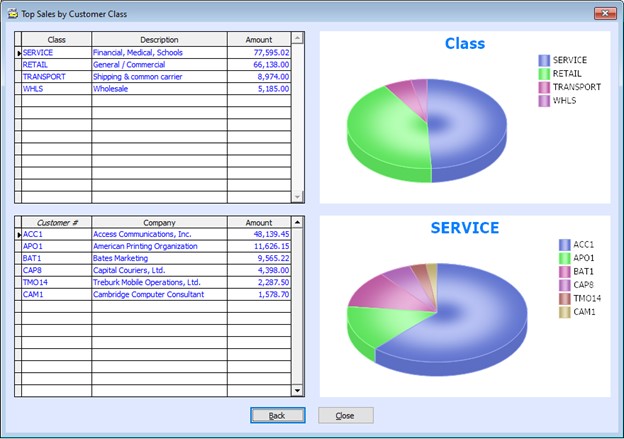
The Top Sales by Customer Class function provides information on the companys top-performing customer classes based on total sales. It presents a data grid showing the customer class, class description, and sales amount, all ranked from highest to lowest, as well as the customers that belong to each class with their company names and sales amounts, sorted from highest to lowest. You can filter results using various parameters, including customer class, customer number, invoice number, salesperson number, industry, territory, and invoice date. The data grid can be exported to Microsoft Excel for further analysis. A pie graph is also shown, visually displaying the proportion each customer class contributes to the total sales for the specified period, allowing for quick identification of high-impact customer classes and their relative impact on overall revenue. This function supports strategic decision-making by highlighting top revenue-generating customer
classes, enabling targeted sales and marketing strategies to maximize profitability and strengthen
relationships with high-value customers in specific classes.
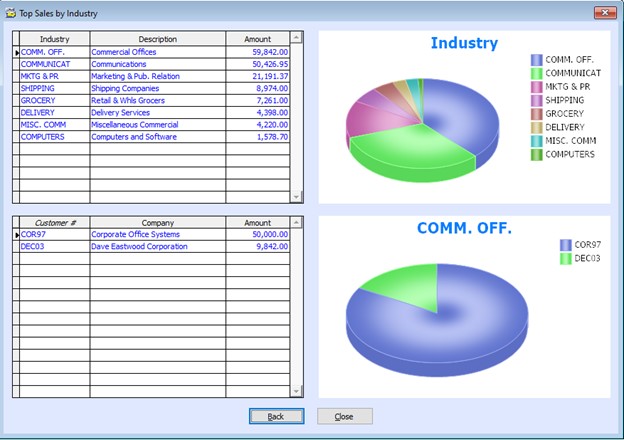
The Top Sales by Industry function provides information on the companys top-performing customer industries based on total sales. It presents a data grid showing the customer industry, industry description, and sales amount, all ranked from highest to lowest, as well as the customers that belong to each industry with their company names and sales amounts, sorted from highest to lowest. You can filter results using various parameters, including the customer industry, customer number, invoice number, salesperson number, class, territory, and invoice date. The data grid can be exported to Microsoft Excel for further analysis. A pie graph is also available, illustrating the proportion each industry contributes to total sales within the selected timeframe, providing a clear visual of high-impact industries. This function is designed to support strategic decision-making by identifying which industries
generate the most revenue, enabling more focused sales and marketing efforts. It helps target
high-value customers within those top-performing industries.
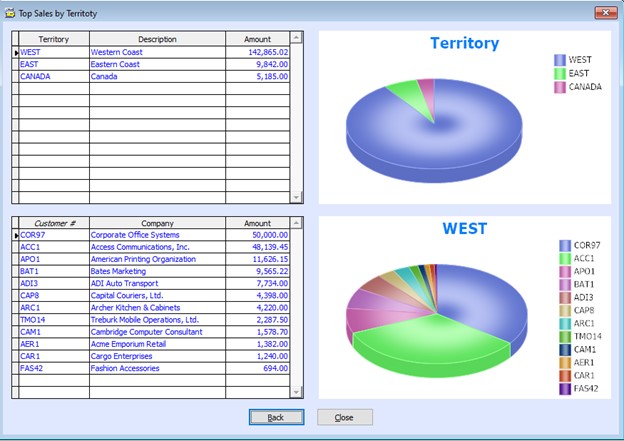
The Top Sales by Territory function provides information on the companys top-performing customer territories based on total sales. It features a data grid that includes the customer territory, territory description, sales amount (ranked highest to lowest), and customers in each territory (with company names and sales figures, also sorted in descending order). You can narrow down data using parameters, including the customer territory, customer number, invoice number, salesperson number, class, industry, and invoice date. You can easily export the data to Microsoft Excel for deeper analysis. A pie graph is also available, showing each territorys contribution to total sales during the selected timeframe, providing a quick visual of the most impactful territories. This function helps you in making strategic decisions by highlighting top revenue-generating
territories, identifying high-value customers within those territories, and focusing sales and
marketing efforts toward the most profitable territories.
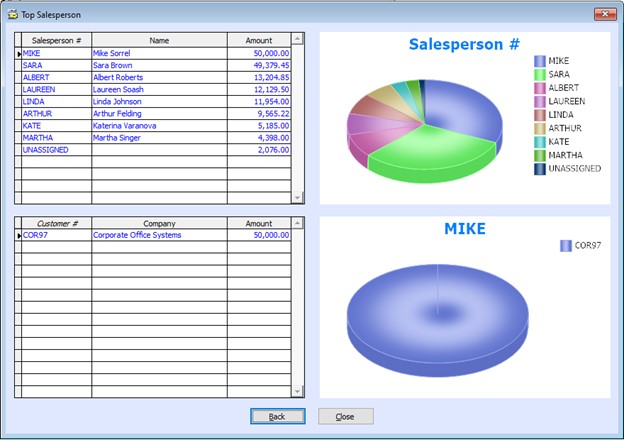
The Top Salesperson function highlights the companys highest-performing sales personnel based on total sales. You can view in the data grid the salespersons number, name, and sales amount, automatically ranked from highest to lowest. The grid also shows a breakdown of customers assigned to each salesperson, their company names, and their respective sales amounts, also sorted from highest to lowest. You can easily filter information in the grid using multiple parameters, including the salesperson number, customer number, invoice number, class, industry, territory, and invoice date. You can easily export the data to Microsoft Excel for deeper analysis, reporting, or sharing. A pie graph presents each salespersons contribution to total sales within the selected invoice date range, offering a quick and intuitive view of sales distribution across the team. This function supports strategic decision-making by enabling you to identify and recognize top
revenue-generating salespeople, pinpoint high-value customers assigned to those salespersons, and
optimize sales and marketing efforts by focusing on the most profitable areas of your sales organization.
 |
 Top Sales by Customer


